Welcome to our Live Air Data Map – click on the station icons to access near-real time hourly readings from our monitoring stations in the WCAS region.
Questions about the data? Contact us – we can help!
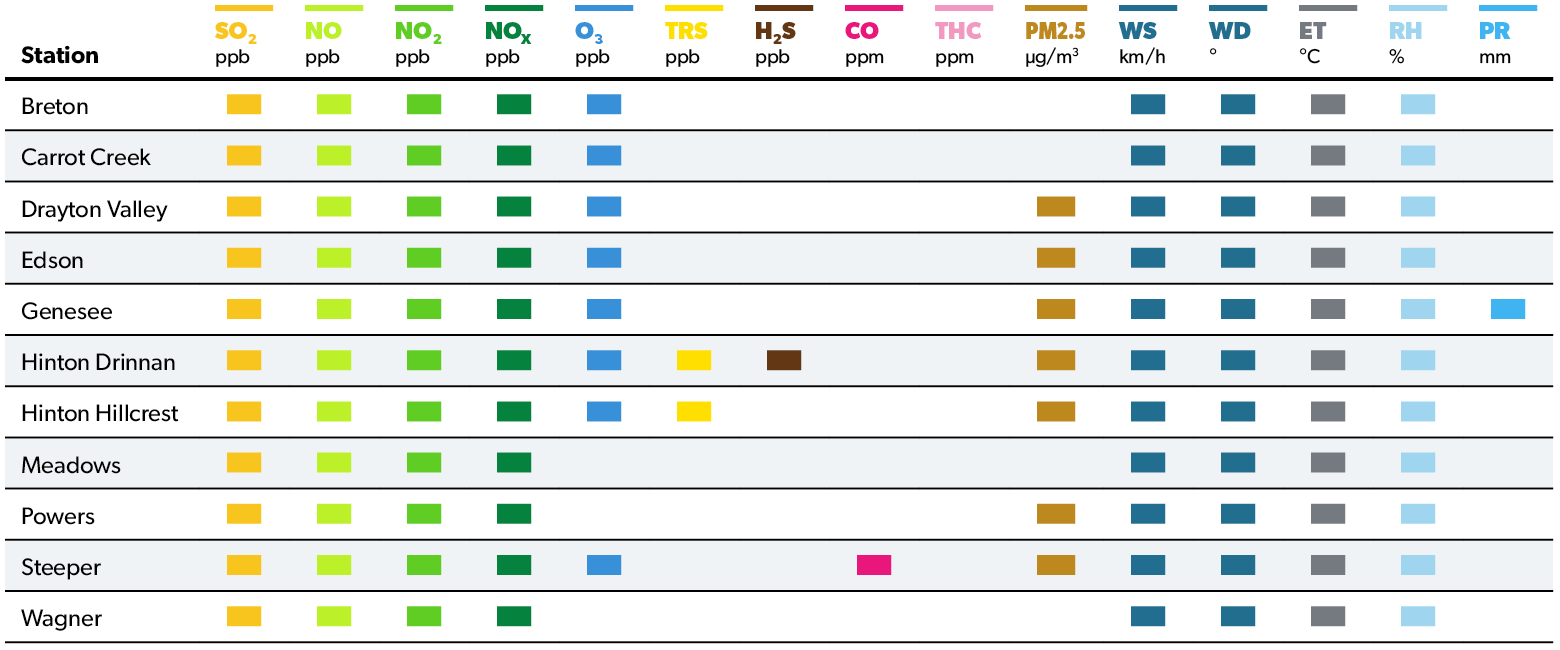
The parameters measured at each station are summarized in the following table – click here to learn more about what they are and why we monitor for them.
Things to remember:
- Live air data for our continuous monitoring stations can also be found on the Alberta AQHI Map.
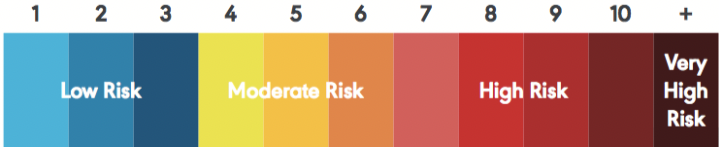
- Microsensor data is presented as an hourly modified Canadian AQHI+ scale based on PM2.5 only. It is not a representation of the full AQHI, which also includes Nitrogen Dioxide and Ozone, averaged over three hours.
Reference for Correction Factor
Reference for Smoke-optimized AQHI Scale
- Click here for more information about the Air Quality Health Index (AQHI).
- The data are recorded in Mountain Standard Time. Data are generally indicative of ambient conditions but it is raw data. Our quality controls validate the information and then it is stored in a Government of Alberta Air Data Warehouse.
- If there are breaks in the data, it simply means data was not recorded for that time period. Often, this is due to scheduled equipment maintenance or calibrations being made at that time.
- From time to time data points may be removed after they have been found to be in error due to instrument malfunction.
- Negative numbers that may appear have not yet been referenced to the daily zero check.